| dc.contributor.author | Rea, Jack | |
| dc.contributor.author | Clark, Payton | |
| dc.contributor.author | Vassar, Matt | |
| dc.date.accessioned | 2023-09-12T16:45:10Z | |
| dc.date.available | 2023-09-12T16:45:10Z | |
| dc.date.issued | 2022-02-18 | |
| dc.identifier | ouhd_Rea_genderandgeographicalrepresentation_2022 | |
| dc.identifier.citation | Rea, J., Clark, P., & Vassar, M. (2022, February 18). Gender and geographical representation in the National Institute of Health’s Neuroscience and Behavior Study Section (AA4): A longitudinal analysis. Poster presented at Research Days at Oklahoma State University Center for Health Sciences, Tulsa, Ok. | |
| dc.identifier.uri | https://hdl.handle.net/11244/339547 | |
| dc.description.abstract | Background: Previous studies support the experience of gender and geographical bias in research scientists that receive funding from the National Institute of Health (NIH) in terms of the application success rate and the amount of money received (Silva et al., 2020; Wahls, Wayne, 2016). Our team analyzed gender and geographical differences in the NIH's Neuroscience and Behavior (AA4) study section members to investigate these disparities further. | |
| dc.description.abstract | Methods: Using a pilot-tested google form, we collected the members' names, academic degrees, roles within the study section, institutional affiliations, and geographical location of their institutions from all meetings in 2011, 2016, and 2021. To determine gender, we used their online profiles or genderize.io (probability > 0.60); for geographical location, we used the United States Census Bureau's region map. | |
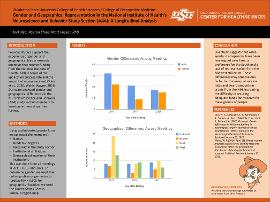
| dc.description.abstract | Results: Overall, gender distribution has been trending towards equal values for men and women across all three years. From 2011 to 2016, the number of women decreased (n=54, 41% to n=30, 30%) before the levels of men and women became relatively equal (n=32, 47% women, 53% men). As far as geographical distribution goes, the Midwest region consistently ranked as the lowest represented region every year, with a slow gain towards equal representation in 2021 (n=30, 17%). On the other hand, the South began as overrepresented in 2011 (n=52, 47%); in 2021, it leveled out to approximately 33% (n=30). | |
| dc.description.abstract | Conclusion: Our study suggests that while gender discrepancies have been leveling out over time, a preference for the South and a lack of representation from the Midwest still exists. These differences may propose one factor for the unequal success rates and award amounts in grants from the NIH, increasing the difficulty in securing adequate funds for research for these groups of people. | |
| dc.format | application/pdf | |
| dc.language | en_US | |
| dc.publisher | Oklahoma State University Center for Health Sciences | |
| dc.rights | The author(s) retain the copyright or have the right to deposit the item giving the Oklahoma State University Library a limited, non-exclusive right to share this material in its institutional repository. Contact Digital Resources and Discovery Services at lib-dls@okstate.edu or 405-744-9161 for the permission policy on the use, reproduction or distribution of this material. | |
| dc.title | Gender and geographical representation in the National Institute of Health’s Neuroscience and Behavior Study Section (AA4): a longitudinal analysis | |
| osu.filename | ouhd_Rea_genderandgeographicalrepresentation_2022.pdf | |
| dc.type.genre | Presentation | |
| dc.type.material | Text | |
| dc.subject.keywords | gender inequality | |
| dc.subject.keywords | geographic inequality | |
| dc.subject.keywords | NIH study sections | |
| dc.subject.keywords | neuroscience | |
| dc.subject.keywords | funding | |