| dc.contributor.advisor | Arnall, Daryl Brian | |
| dc.contributor.author | Watkins, Patrick | |
| dc.date.accessioned | 2018-03-13T18:16:31Z | |
| dc.date.available | 2018-03-13T18:16:31Z | |
| dc.date.issued | 2017-05 | |
| dc.identifier.uri | https://hdl.handle.net/11244/54627 | |
| dc.description.abstract | Phosphorus deficiency in no-till winter wheat (Triticum aestivum L.) production can result in drastically reduced yields in north central Oklahoma. As a result, many producers are attempting to increase phosphorus application efficiency through the implementation of best management practices (BMP's) such as, soil test based fertility recommendations. Regardless of product source or application rate, phosphorus management may be confounded by the fact that current sampling methods and rate recommendations in Oklahoma were developed utilizing fields under conventional tillage. During the 2014 and 2015 winter growing seasons, nine on farm studies were established across north central Oklahoma with varying soil types representative of the region. Locations had an initial Mehlich III extractable soil P concentrations ranging from 1 - 39 mg kg-1 in the top 15.24 cm of soil at planting. Soil pH ranged from 4.6 to 6.8 across the nine locations (Table 1.3). Phosphorus fertilizer was surface applied at planting in the form of triple super phosphate. Application rates included an OSU Soil Test recommended rate which utilized the current soil test P index, and eleven phosphorus rates ranging from 0 kg P ha-1 up to 48.9 kg P ha-1 in increments of 4.89 kg P ha-1 (Table 1.1). Grain test weight and moisture were not significantly affected by the addition of surface applied phosphorus. Wheat grain phosphorus concentrations were on average increased with the addition of phosphorus fertilizers but the response varied across treatment rates (Table 3.1). Wheat grain yield was on average significantly increased by the addition of surface applied phosphorus fertilizer (Table 1.3). However, individual site specific issues did arise and each location is discussed individually (Table 3.3). Across the nine locations soil pH and Mehlich III soil phosphorus concentrations were significantly affected by the sampling depth. As sampling depth increased soil pH increased and Mehlich III soil extractable P decreased. Soil pH of the 0 - 5.08 cm sampling depth was the best indicator of responsiveness of no-till winter wheat. | |
| dc.format | application/pdf | |
| dc.language | en_US | |
| dc.rights | Copyright is held by the author who has granted the Oklahoma State University Library the non-exclusive right to share this material in its institutional repository. Contact Digital Library Services at lib-dls@okstate.edu or 405-744-9161 for the permission policy on the use, reproduction or distribution of this material. | |
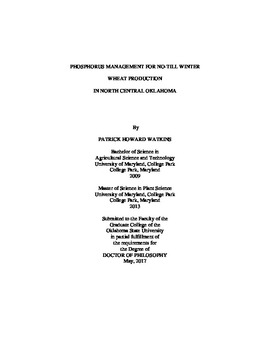
| dc.title | Phosphorus management for no-till winter wheat production in north central Oklahoma | |
| dc.contributor.committeeMember | Raun, William | |
| dc.contributor.committeeMember | Warren, Jason | |
| dc.contributor.committeeMember | Goad, Carla Lynn | |
| osu.filename | Watkins_okstate_0664D_15190.pdf | |
| osu.accesstype | Open Access | |
| dc.type.genre | Dissertation | |
| dc.type.material | Text | |
| thesis.degree.discipline | Soil Science | |
| thesis.degree.grantor | Oklahoma State University | |
